Over a period of about 10 years from 2006 to 2015, the amount of nitrogen dioxide (NO2) in the atmosphere was in significant decline. Stricter regulations on vehicle emissions, the most common source of nitrogen dioxide, led to year-over-year reductions in the amount of pollution in the air. However, in the past several years, scientists noticed in 2017 something odd — while the amount of nitrogen dioxide in the atmosphere was not increasing, levels were not decreasing as much as they had in the previous decade.
That is why engineers at the University of Iowa and the University of Colorado at Boulder are partnering on a three-year, $565,000 grant from NASA to use satellite images processed by high-performance computing to determine why the nitrogen dioxide declines seem to have leveled off. The team will use data collected from multi-sensors aboard NASA’s Aura satellite and Suomi National Polar-orbiting Partnership (Suomi-NPP) satellite as well as European’s TROPOspheric Monitoring Instrument (TROPOMI) satellite.
“There are a number of new energy production methods, such as fracking, that could contribute to nitrogen dioxide emissions,” says Jun Wang, a professor of chemical and biochemical engineering and assistant director of the Center for Computer-Aided Design at the UI and principal investigator on the project. “While we continue to work to reduce nitrogen dioxide emissions from vehicles, it is possible that those reductions are being offset by other new sources.”
Increased urbanization also may contribute to increases in nitrogen dioxide pollution, even if the amount of nitrogen dioxide in the atmosphere is not increasing, Wang says.
Nitrogen dioxide is a toxic precursor of nitrate acid, which is partially responsible for acid rain, and nitrate particle, which is part of particulate pollution and regional haze. Nitrogen dioxide is known to lead to increased production of ozone pollution in many urban areas. It is one of six primary pollutants monitored daily by Environmental Protection Agency to assess air quality and the compliance of each state with the National Ambient Air Quality Standard, as mandated by the U.S. Clean Air Act.
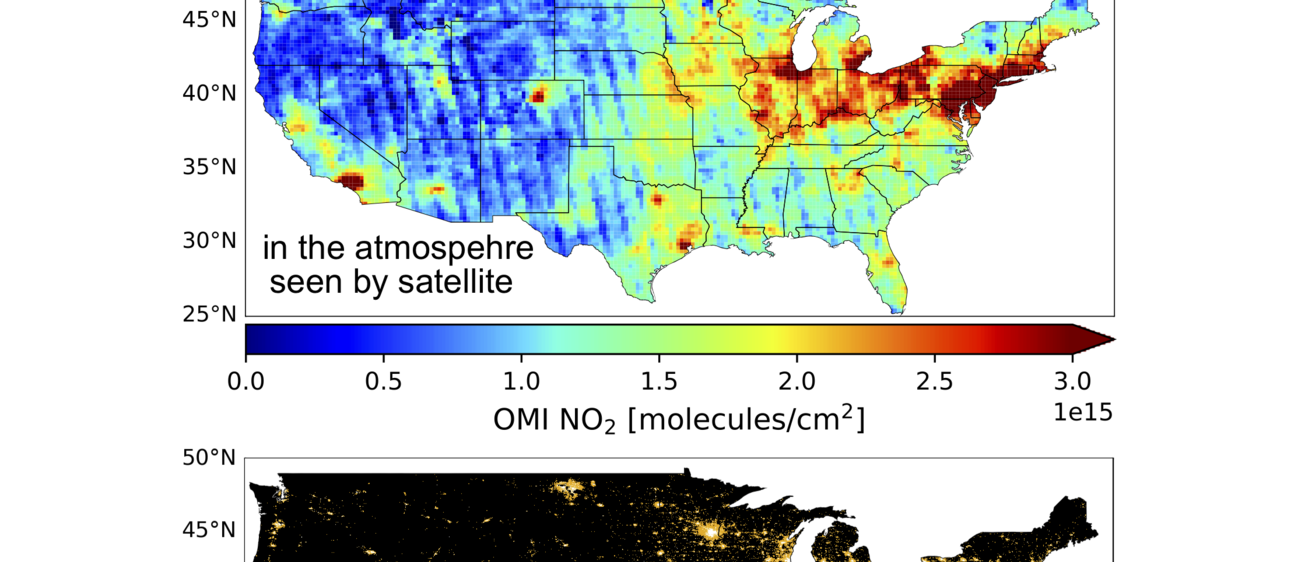
However, the ground monitors used by the EPA are not sufficient to describe how nitrogen dioxide is distributed, and the monitors vary in location and time across the country, which is why using satellites in this study will be valuable.
Using a method called inverse modeling, Wang and other engineers will use massive satellite data sets to trace the original sources of the nitrogen dioxide. One unique set of satellite data that will be used describes the distribution of artificial light at night as seen by Visible Infrared Imaging Radiometer Suite (VIIRS) aboard Suomi-NPP satellite. The change of artificial light at night may suggest areas where nitrogen dioxide levels may be increasing, Wang says.
Wang says researchers aim to discover how and why nitrogen dioxide emissions are changing, especially at the local community level. The results of the research will be helpful for policy makers to formulate future policies to improve air quality and protect the environment.